

While index insurance is promoted as an affordable alternative to conventional insurance in developing countries, its value for farmers is rarely assessed. In this note, we suggest a framework to measure index insurance quality and show how this approach can help design and compare insurance products.
 Insurance Value for Farmers
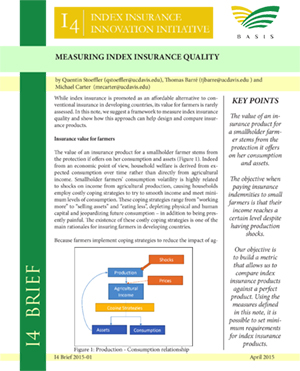
The value of an insurance product for a smallholder farmer stems from the protection if offers on her consumption and assets (Figure 1). Indeed from an economic point of view, household welfare is derived from expected consumption over time rather than directly from agricultural income. Smallholder farmers’ consumption volatility is highly related to shocks on income from agricultural production, causing households employ costly coping strategies to try to smooth income and meet minimum levels of consumption. These coping strategies range from “working more” to “selling assets” and “eating less”, depleting physical and human capital and jeopardizing future consumption – in addition to being presently painful. The existence of these costly coping strategies is one of the main rationales for insuring farmers in developing countries.
Because farmers implement coping strategies to reduce the impact of agricultural shocks on consumption (see Figure 1), it is not possible to assess the need for (or the quality of) an insurance product by looking at consumption levels. For that reason, index insurance usually operates at the agricultural production level and insurance quality has to be assessed based on how well insurance payments correlate with agricultural production.
“The value of an insurance product for a smallholder farmer stems from the protection it offers on her consumption and assets.”
More precisely, assessing the quality of an insurance product consists in evaluating, for a given price (premium), the degree of correlation between insurance payments received by farmers and production shocks. Indeed, the cost of the premium, the probability of receiving a payout when experiencing a loss and the amount paid when the index triggers all matter in assessing the value of an insurance product for the client. Evaluating the insurance value is important since at a given price, the quality of the insurance may be too low to be implemented and sold to farmers. Also, developing an agreed measure of the quality of different products allows us to compare them and determine which ones perform better in theory, which ones need to be improved upon, and to what extent takeup can be explained by insurance quality.
Measuring Index Insurance’s Income Stabilization Impact
A simple approach for assessing insurance quality is to consider how well it achieves its income stabilization objective for farmers. Indeed, the objective when paying insurance indemnities to small farmers is that their income reaches a certain level despite having production shocks – and satisfies some consumption needs without depleting their assets. An index insurance product fails entirely when it does not compensate large yield losses and leaves a farmer below a minimum agricultural income level, unable to feed her family, repay her debt, etc.
“The objective when paying insurance indemnities to small farmers is that their income reaches a certain level despite having production shocks.”
Figure 2 presents farmers’ agricultural income without insurance, with a perfect insurance, and with an index insurance. In this note’s examples, we set this target income level at 75% of the historical average agricultural income.
Perfect Insurance Contract
A perfect insurance product would ensure that the farmer always receives at least 75% of her historical average agricultural income and pays a premium that is actuarially fair. In this case, the farmer’s income is slightly lower in the good states of nature (when his yield is higher than 75% of the historical average) because he pays an actuarially fair premium, but is stabilized at 75% of the historical average in bad states of nature (when the yield is lower than 75% of the historical average). This puts a floor on farmers’ income. Figure 2 draws the income received by the farmer without insurance (short-dashed grey line) and with a perfect insurance (solid black line) as a function of the level of yields (in percentage of the historical average).
Index Insurance contract
Index insurance cannot protect farmers as well as a perfect insurance product, but our objective is to build a metric that allows us to compare index insurance products against a perfect product. Specifically, we want to know how far we are from our consumption stabilization objective, and be able to rank different index insurance products based on their ability to stabilize income. The long-dashed black line in Figure 2 draws the expected income per yield level (in % of historical average) for a farmer purchasing an imperfect index insurance product. In this example, in the bad state of nature, the index “makes mistakes” and pays less than required. As a consequence, income is not fully stabilized at the 75% level floor, lowering the value of the index insurance for farmers. In addition, the insurance sometimes pays too much when there are small or no losses, so the index insurance expected income is higher than income with the perfect insurance in the center of the graph. These indemnities received when yields are normal and good are costly: farmers pay higher premium each year to receive these indemnity payments when they don’t need it. This also lowers the value of the insurance for farmers.
“Our objective is to build a metric that allows us to compare index insurance products against a perfect product. Specifically, we want to know how far we are from our consumption stabilization objective, and be able to rank different index insurance products based on their ability to stabilize income.”
The grey area separating the perfect insurance line and the index insurance line measures the quality gap of the index insurance product compared to a perfect insurance contract. The larger the area, the lower the quality of the contract. Note that having the index insurance curve above the perfect contract line also reduces the quality of the index product because it gives too much indemnities compared to the losses incurred, which means that the index is getting closer to a lottery ticket, i.e. is not correlated to actual losses.
Quality Measures
For properly assessing insurance value, is necessary to consider how often and how much it pays depending on the yield obtained by farmers for a given premium. To capture these desirable features of an insurance product, Clarke and al. (2012) suggest intuitions for two indices: (i) the probability of receiving a payment by level of loss; and (ii) the ratio of expected claim payment over premium by level of loss. We extend these two indices to take into account other features of the quality of the insurance, specifically by weighting the indices according to the probability of each yield level. Again, this approach allows to measure the distance from a perfect insurance and to compare different index insurance products to choose those offering the best “value-for-money” to poor farmers.
“For properly assessing insurance value, it is necessary to consider how often and how much it pays depending on the yield obtained by farmers for a given premium.”
The Probability of Receiving a Payment Given the Level of Loss
In the case of a perfect index insurance contract, a farmer would always receive a payment when experiencing a loss, and would never receive a payment when not experiencing a loss. Such ideal index is represented by the solid black line in Figure 3. In practice, index insurance contracts always convey some probability to receive a payment in good years (a “false positive” index value) and – arguably more detrimental to farmers in the short term – the risk of not receiving a payment when actually experiencing a shock (a “false negative” index value). In this latter case, the farmer is worse-off with insurance than without since she paid the premium. An example of such imperfect contract is represented by the dash-black line in Figure 3. The area separating the two curves measures the distance to the perfect insurance, i.e. the quality gap of the index insurance product. The larger this area, the lower the quality of the index.
If insurance value for farmers stems from its benefits in terms of consumption, one can focus on “false negative” index values, when the farmer suffers from a loss but does not receive an indemnity.
Ratio of expected indemnity over premium by level of loss
While the previous quality index focuses on the appropriate timing of payments, the second quality measure adds the extent of indemnities and the amount of premium paid. Indeed, Figure 4 shows the average amount of indemnity received, divided by the amount of premium paid, for each level of yields. Again, the perfect insurance product is represented by the solid line, under which the amount of indemnity corresponds to the level of shock received (thus decreasing with the level of yields).
“This index verfies that indemnities are commensurate with the extent of losses.”
In a perfect insurance case, indemnities would cover the loss (minus the deductible) that the farmer experiences. The case of the (imperfect) index insurance is represented by the dash black line, whose expected indemnities are much lower when the farmer experiences losses. Farmers also receive indemnities during good/normal years (false positives) when the farmer has normal and good yields.
Comparing Insurance Products' “Value-for-Money” – the Simple Case
This simple “value-for-money” approach allows us to compare different insurance products in order to implement the best contract available or to improve low quality insurance products. Figure 5 presents two index insurance products where the insurance A dominates the insurance B whose expected indemnity over premium is lower for any yield loss, and higher when yields are good. In that case, the index insurance contract B is clearly better since farmers have higher expected indemnity payouts for any level of loss.
“This simple ‘value-for-money’ approach allows us to compare different insurance products in order to implement the best contract available or to improve low quality insurance products.”
Comparing Insurance Products “Value-for-Money” – Complex Cases
Sometimes however, it is not clear which insurance product is better because neither dominates all the time. In Figure 6, the index insurance contract B pays higher expected indemnities when the yields are very bad (left side of the graph). However, when yields are slightly better but still far from the historical average, contract C pays higher indemnities. Contract B for instance could insure for the greatest shocks only (e.g. weather events) and fail to protect farmers well against other milder types of shocks (e.g. pest). Contract C on the other hand could be based on an index which protects farmers for all type of shocks, including mild shocks, but does not protect them as well against extreme shocks.
In this situation, it is not obvious which contract would be preferred by farmers. If the two quality gap measures are equal, farmers might still prefer B over C. Indeed, farmers would be sometimes better with contract B (large shocks) and sometimes better with contract C (smaller shocks). Two considerations have an impact on how farmers value insurance B compared to insurance C: i) smaller shocks tend to happen more often than larger shocks; ii) larger insurance errors are more detrimental for them. Thus, two additional features have to be taken into account to measure which products is better: the probability of events and the fact that the severity of insurance errors matters.
Accounting for Yield Probability
One weakness of the “area under the curve” quality indices presented above is that they put the same weight on every loss level while extremely low yield levels happen less frequently than moderately low yield levels so that one could argue that we should put more weight on index errors on yields levels that happen more often. Extending the measures presented above to account for the yield probability allows us to properly measure insurance quality value, given the fact that all levels of yields are not equally likely (see Appendix 1).
“Extending the measures presented above to account for the yield probability allows us to properly measure insurance quality value.”
Accounting for the Severity of Insurance Errors
Arguably, farmers will be more sensitive to bigger failures of the index insurance – which can draw their consumption below subsistence level or force them to deplete assets – compared to a small quality gap at any level of yields. To represent this feature of index insurance quality, the previous indices can be extended in the fashion of the Foster-Greer-Thorbecke (FGT) indices, putting more weight on greater insurance errors (see Appendix 1). In figure 6 above, insurance B would have a lower quality gap measure (higher quality) than insurance A with the same area under the curve because insurance A is “flatter” (not as well correlated with bad yields).
“Using the measures defined in this note, it is possible to set minimum requrements for index insurance products.”
Setting Minimum Requirements for Index Insurance Products
The contract quality measure proposed in this note allows us to rank different contracts and tells us how far we are from a perfect contract. However, it does not tell us if the best feasible contract is good enough to be commercialized. Does it reach a minimal quality measure so that it can benefit farmers?
Using the measures defined in this note, it is possible to set minimum requirements for index insurance products. One possibility is to calculate whether an insurance product, on average, leaves insured farmers below a certain minimum income level. For instance, it is possible to find a minimum income level below which households cannot meet minimum consumption levels without being forced to start selling productive assets (such as plowing ox or land) or employ other costly coping strategies that jeopardize their future well-being. Not protecting households from this situation is a clear failure of the insurance product: an insurance product with which this level of income is still expected on average after insurance payments should not be sold to farmers. A conservative manner to determine this minimum income level is to use the threshold below which a farmer cannot feed her family without depleting her household human and physical capital (see Appendix 2).
Second, it is also possible to use economic theory to indicate whether or not a particular index insurance contract should be sold. Indeed, expected utility theory is a framework which allows us to compare the welfare that a farmer expects to obtain under two alternatives: with or without index insurance. This approach takes into account the probability of events (yields) and the fact that individuals are more averse to extremely low levels of income. Given the fact that the population is heterogeneous (in terms of risk preferences, wealth, etc.), it is possible to compute the share of the population for which the insurance product would be welfare improving. This would give an indication of the relevance of commercializing this particular insurance product, especially if the product receives public funds.
Conclusion
The objective of Index-based insurance contracts is to stabilize farmer’s agricultural income in order to protect their consumption and assets. In order to sell insurance products which reach this target, it is necessary to assess the quality of insurance product. A good measure of quality takes into account several features: average amount of money received for a given premium at different yield levels, the distribution of the events, and the severity of the insurance failures. Several simple indices can be obtained to compare different insurance products, and efforts could be focused on those who meet minimum quality criteria.
One great advantage of the indices presented in this note is that they can be computed using the same data required to design a product, and don’t add any additional cost in terms of data collection. However, regardless of the method used, a greater attention has to be paid to index insurance quality using data collected at the farmer level. Estimating the quality of an index insurance product in advance can be difficult for farmers, which is why poor quality products should not be commercialized. Indeed, low insurance quality will not only decrease insurance demand and fail to protect farmers, but eventually seriously damage livelihoods of farmers purchasing the insurance. Conversely, insurance designs based on product quality for farmers can foster insurance take-up, increase ex-ante productive impact and provide ex-post protection to actual shocks.
Quentin Stoeffler is a Ph.D. candidate in agricultural and resource economics at UC Davis.
Thomas Barré is a post-doc in agricultural and resource economics at UC Davis.
Michael Carter, a UC Davis professor of agricultural and resource economics, is the director of the Feed the Future Innovation Lab for Assets and Market Access.
Publication made possible by support in part from the US Agency for International Development Cooperative Agreement No. AEG-A-00-08-00008-00 through the Assets and Market Access Collaborative Research Support Program. Funding for this project was provided by the United States Agency for International Development. All views, interpretations, recommendations, and conclusions expressed in this paper are those of the authors and not necessarily those of the supporting or cooperating organizations.