
Low levels of education, lack of access to credit and technology, insecure property titles, poor infrastructure—constraints such as these are typical of rural areas in most developing countries, particularly in the agricultural sector. Implementing development strategies to eliminate or ease these constraints can help farmers realize a greater productive potential. In 2005, the Nicaraguan government, in cooperation with the Millennium Challenge Corporation (MCC), devised a rural economic growth and poverty reduction program for the high-potential Pacific coast departments of León and Chinandega.
 The program had three components: construction and/or rehabilitation of 74 kilometers of highway and rural secondary roads; provision of legally secure titles for landowners by mapping properties, resolving disputes, improving documentation, and land registry capacity building; and, provision of rural business development services, including technical and financial assistance and providing improved market information and linkages. This brief focuses on the direct impacts of this third component, the rural business development (RBD) project.
How well have RBD services worked thus far, and for whom? This brief reports results from the mid-point of a four-year impact evaluation of the RBD project, carried out by a team from the Universities of Wisconsin and California. Using survey data and a randomized rollout strategy, the team’s chief findings show that the average increase in RBD household incomes is small (3% more than the change in control household income) and not statistically different from zero. However, this average effect is somewhat misleading.
When more general analytical methods are used, they reveal that the top performing RBD households experience income increases that are statistically significant and are some 10% higher than the increases experienced by similarly high performing control group households. The impact study will continue to follow these groups, and future analysis will reveal whether impacts will grow and spread more broadly across the RBD participant population.
The Nicaragua-MCC Compact
After the Nicaraguan government presented its regional rural development proposal to MCC, an intensive consultative process led to the signing of one of the first MCC compacts and agreement on a multifaceted program to help raise incomes for farmers and other rural business people. A Nicaraguan entity, the Millennium Challenge Account (MCA-Nicaragua), was established to fund and implement the program. The goal of MCA-Nicaragua is to boost the productive capacity in the departments of León and Chinandega, the country’s rural “breadbasket,” which has proven growth potential due to its fertile land and connection to international markets.
The compact identified low-value rural business and farm activities as a major constraint to economic growth, and the RBD project was established to confront this problem. In conjunction with this project, MCA-Nicaragua planned to implement a property regularization project designed to decrease the cost of land transactions and increase tenure security. In isolation, evidence of positive impacts from property programs is mixed.
MCA’s strategy of combining a study of the impacts of property regularization with the impacts of business services was a novel way of trying to determine what mixture of projects has the greatest chance of improving incomes for rural producers. However, while the Nicaraguan government continues to implement the property registration project, MCA’s involvement in that component was cancelled. Therefore, the initial evaluation results reported here do not include analysis of titling impacts.
MCA expects that RBD will train approximately 10,000 rural people—primarily farmers, but also artisans and other rural business people—in a variety of technical areas. As a result of thousands of people transitioning into higher-value agriculture, MCA projects that the additional profits and wages could total US$30 million annually, beginning six years after RBD’s launch in 2007.
Is this bold projection being met? To answer this question, a comprehensive impact evaluation was designed to evaluate the experience of agricultural and livestock producers who participate in the RBD project. By comparing differences between “treated” households (those eligible to participate in the project from the beginning) and “control” households (those eligible for the project, but whose participation was delayed by the rollout calendar), the impact evaluation can determine the extent to which providing business services improves the economic wellbeing of households beyond what it would be in the absence of such services. As this brief will show, the evaluation also provides a picture of the types of households that benefit most from the RBD project.
Eligibility and Implementation
To be eligible for RBD services, a producer must run a small- or medium-sized farming or livestock operation. To operationalize this concept, MCA established eligibility criteria that varied based on a farmer’s sphere of economic activity. The box lists criteria for livestock producers. For example, operations that are either too large (more than 100 cows), or too small (fewer than 10 cows) are ineligible for RBD services.
The logic for the eligibility ceiling is obvious, as the MCA project was not intended to subsidize the activities of well-positioned rural producers who are less likely to face the constraints that confront the less well off, including uncertain land ownership, poor access to financial services, weak entrepreneurial and technological skills, and tenuous links to markets. The eligibility floor, and where it should be set, is more controversial and is an issue that confronts rural development projects the world over. The imposition of a floor is meant to assure that all eligible farmers operate at a minimum scale needed to be successful and to justify onfarm investments, yet a higher floor also excludes less welloff households from direct project benefit. The impact evaluation opens a window into the implications of these eligibility criteria.
In 2007, the RBD project began with a massive campaign to attract participation. Offices were opened in the main regional cities of León and Chinandega, where farmers could learn about the project and volunteer to take part. As the project was being advertised throughout the two departments, coordinators chose areas where agro-climatic and other conditions favored the development of specific types of businesses.
The coordinators then identified farmers engaged in the same type of productive activity, first focusing on livestock, bean, sesame and cassava, since these represented MCA’s most important target areas. Given the interest shown by farmers in other crops, the project was extended to products such as plantain, rice, honey and fruit. Farmers engaged in the same type of productive activity and in geographic proximity were listed as “clusters” of producers, all eligible for business services under the stated criteria for that activity.
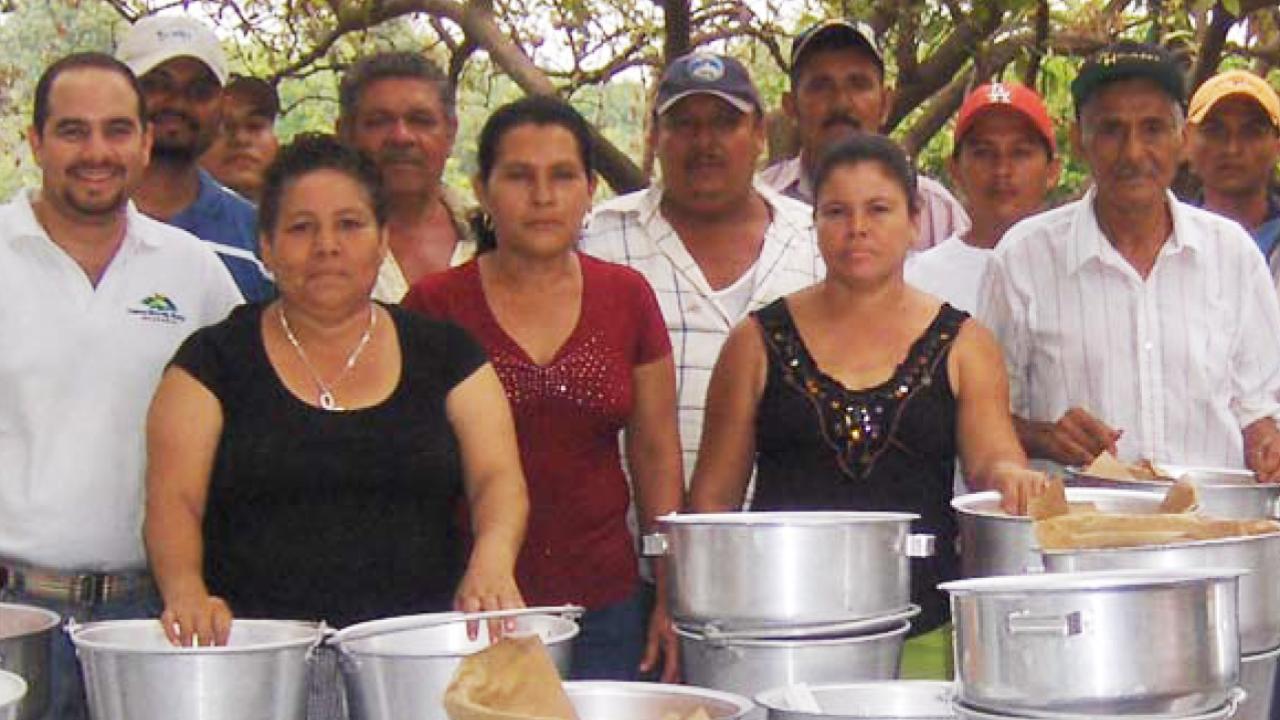
Within each cluster, those who chose to participate in the project formed a “nucleus” of producers. For each nucleus, a lead farmer was designated, with the other participants in that production cluster considered “satellite farmers.” The lead farmer had to be willing to invest more in his or her operation than the satellite farmers invest in theirs, for example allocating some land for a milk collection center to be used by all members of the nucleus. The lead farmer also must coordinate technical meetings with the satellite farmers. Given the importance of the leader’s farm, satellite farms are in relative proximity.
Each member of the nucleus develops a business plan with the support of MCA professionals. After the business plan is approved, MCA works with participating farmers for 24 months. Project benefits depend on the productive activity; in general, all participating farmers receive technical and financial training, and supplies. If an investment is required, the project can provide up to 30% of the financial resources needed. In other cases, a commercialization network might be provided to some nuclei to improve distribution and marketing channels.
Data collected for the impact evaluation offer a sense of how the eligibility criteria shaped the targeting of the RBD project—that is, how effectively does the project target the poor population in León and Chinandega? According to a national living standards measurement survey carried out by the Instituto Nacional de Información de Desarrollo (INIDE), 34% of the rural population in León and Chinandega was under a standard $2 per-person, per-day poverty line in 2005. (This and all other figures in this brief are expressed in 2005 purchasing power parity adjusted US dollars, or PPP US$.) The income distribution for the INIDE rural León and Chinandega sample is presented as the dashed line in Figure 1.
How do those who participated in the RBD project compare to these figures? As shown by the solid line in Figure 1, only 2% of RBD participants were below the standard “$2-a-day” poverty line prior to initiation of the program. From the figure we can also see that the eligibility criteria effectively targeted direct benefits toward the upper 50% of the rural income distribution in León and Chinandega, with the median income of participants approximately US$6 a day. It may be that the lower 50% of people will benefit indirectly through job creation, but such an analysis is beyond the reach of the present impact evaluation.
Evaluation Strategy
The challenge of this and all impact evaluation efforts is to identify a control group that is identical to the treatment group in every way except that the controls have not benefited from the project. For the RBD project, the evaluation strategy exploited the fact that, due to capacity constraints, not all eligible farmers could be brought into the project immediately. After working with MCA to identify all the geographic clusters that eventually would be brought into the project, the evaluation team and the RBD office selected a subset of clusters for random assignment to either early or late treatment status.
As shown in the timeline in Figure 2, RBD services were provided in early treatment clusters beginning in late 2007. In late treatment clusters, services were not initiated until approximately 18 months later, or early 2009. Because clusters were randomly allocated to early and late treatment status, we can anticipate that, on average, the late treatment group should function as a valid control group, identical, within a margin of error, to the early group in every way except for the timing of the receipt of RBD services. Thus, the economic status of the late group at the time of the second-round survey in 2009 should be a good predictor of what the status of the early group would have been in the absence of RBD services.
Once the random assignment of early and late clusters was made, the impact evaluation team created a roster of all eligible producers in these clusters, and then randomly selected a sample of 1600 households split between early and late areas. These 1600 households were then invited to participate in the impact study, and they completed a baseline survey in late 2007, just as the RBD project was beginning in the early treatment clusters.
Within these clusters, approximately 65% of the eligible households chose to participate in the project. A second-round survey was applied to all 1600 households in the first quarter of 2009, just as the project was rolled out in the late treatment area (see the Figure 2 timeline). While it was not clear at the time of the baseline survey which of the eligible households in the late treatment areas would choose to participate in the project, those households had made their participation decision by the time of the second-round survey.
Similar to the early treatment clusters, 63% of eligible households in late treatment clusters declared their intention to join the project at the time of the second-round survey in 2009. The analysis in this brief considers these households to be participants, although the most recent data found that some of these households ultimately did not join the project because of a change in eligibility criteria for bean farmers.
Because the timing of the surveys and project rollout allows for determination of farmer type in both early and late treatment areas (participants versus nonparticipants), the impact evaluation has the opportunity to study impacts on both eligible households (an intention to treat effect) as well as on participating households (treatment on the treated effect). Because the RBD project could not be instantaneously initiated in all early clusters, the amount of time that these cluster farmers had been receiving RBD services by the 2009 survey varied from six to 18 months, with most early treatment farmers receiving between 12 and 18 months of RBD service.
The survey queried farmers about agricultural practices, marketing, and prices for their product. The survey also implemented a full consumer expenditure module, using the same questions employed by the INIDE living standards measurement survey used to gauge poverty rates in the region and the country as a whole. The results reported here rely on these expenditure measures. Total household expenditure, which should be the mirror image of household income (but is more easily measured), is the primary outcome variable of interest for the impact evaluation. Additional analysis will be undertaken to show the impact of RBD services on technology choices, marketing, and prices received.
As shown in Table 1, the randomization between early and late treatment areas worked well, giving confidence that the late treatment group is indeed a valid control group. According to the 2007 baseline survey, farm households located in communities randomly selected for early receipt of business services were statistically indistinguishable from households in communities slated for later rollout of the project. Prior to the start of the RBD project, mean per-capita and household expenditures per month for the early treatment group were almost identical to that of the late treatment group. Other characteristics (farm size, education levels, age, etc.) also showed no statistical difference between the early and late groups at baseline.
Impacts
The RBD project was hypothesized to increase annual rural household incomes and asset values by enough to justify project costs. Given the initial similarity of the early and late treatment groups, we could evaluate initial project impacts using the second-round survey data collected in February 2009. The top panel of Table 2 presents data on monthly per-capita expenditures for the different groups in the study (early versus late treatment, participants versus merely eligible farmers).
As can be seen, all these figures are quite close to each other, and none of the differences between the groups is statistically significant. For example, mean per-capita monthly expenditure for RBD participant households in the early treatment groups is $225, whereas it is $212 for the non-treated participant households in the late treatment areas (figures again are measured in 2005 PPP US$).
While these numbers from the second round survey are indicative of project impact, we more precisely define project impact as the average increase in monthly per-capita expenditure by farmers who received business services minus the average increase over the same time period for those farmers who did not receive business services. Using this “differencein-difference estimator,” we find that, on average, participants’ per-capita monthly expenditures increased by 4 PPP US$ more than did expenditures for those not yet participating in the project (see the lower panel of Table 2.)
However, these difference-in-difference impacts—which imply about a 2% improvement in the economic wellbeing of the treated—are not statistically significant. Total household expenditures went up approximately 28 PPP US$, a figure that is also statistically insignificant. These calculations ignore the fact that some treated farmers received RBD services for a longer period of time. Future analysis will explore whether impacts vary with the duration of treatment.
Figure 3 graphs the results found in Table 2 to show the implied growth trajectories. Based on analysis of the survey results from both round one (2007) and round two (2009), Figure 3 charts the different actual growth rates during this time period. We might hypothesize that the impact of business services will increase over time as farmers better learn to utilize the new opportunities and as their own investment in these ventures is crowded in. In this way, business services act not unlike an investment in a financial account that accrues interest: the earlier one has the opportunity to participate in the project, the more of a head start in growth for that person’s income, which allows the income to accumulate ever faster over time. The hypothesized growth trajectories on the right side of Figure 3 illustrate what this might look like. The third round survey data, to be collected in the first quarter of 2011, will allow investigation of this hypothesis.
Heterogeneous Treatment Effects
Impact evaluations often use the rise in average monthly expenditures across all study households to gauge the impact of a development program on economic wellbeing. Using this indicator, and as shown in Table 2, the RBD project did not have a statistically significant impact on the monthly percapita expenditures of participating households. Yet this average impact does not tell the full story.
Digging deeper into the analysis, we found that treatment effects are significant for what might be termed high-growth households, those whose growth in per-capita expenditures from the baseline to the second survey is higher than average. Conversely, a low-growth household is one whose expenditure growth is below average. Note that we can rank all early treatment households from lowest to highest growers. A similar ranking can be done for all control (late treatment) households.
Interestingly, we find that if we compare high-growth treatment households with high-growth control households, we obtain estimates of RBD project impacts that are statistically significant and range up to 18 PPP US$ per person, per month, a level that is some four times the average impact reported in Table 2. Conversely, if we compare low-growth treated households with low-growth control households, we find no, or even slightly negative, project impacts.
Econometrically, these heterogeneous impact results were identified using generalized quantile regression analysis. It is important to stress that these results indicate that the treatment effect is not the same across the entire population (program impacts are heterogeneous) and that the average treatment effect poorly represents what is going on in the data.
Figure 4 presents the character of these results in a graphical fashion. On the horizontal axis, we array households in order of their baseline to mid-line growth, with slow-growth households on the left (low percentile rankings) and high-growth households on the right (high percentile rankings). Percentile ranks are calculated separately for treatment and control households. For each percentile range, Figure 4 presents an estimator of the project impact which could be interpreted as a difference-indifference estimator, for example, by taking the expenditure growth for low-growth treatment households and subtracting from it the expenditure growth for low-growth control households. The dotted-dashed impact line in Figure 4 plots these percentile-specific difference-in-difference estimates.
As can be seen, the impacts are insignificant and slightly negative for low percentile households. Among better-performing households (above the 50th percentile), the impacts become positive and statistically significant. At the 50th percentile, the impact estimate is about 8 PPP US$ per person, per month; whereas the impact rises to more than double that level when comparing the highest-percentile treatment households with the highest-percentile control households. If we translate these figures into internal rates of return (assuming that the impacts persist for 15 years and using the actual average program costs), we find that the internal rate of return is 1% at the 50th percentile and 14% at the 90th percentile.
What explains this variation in the impact of the RBD project across households? Given that the RBD project established minimum conditions for project eligibility, we might suspect that the low performers would be those households with fewer assets and lower initial living standards. Importantly, the data do not support this interpretation. Projected onto Figure 4 are the initial baseline living standards of the households in the different growth percentiles. As can be seen, the initial living standards of high performing households are no higher than those of other households. Indeed, if anything, the data suggest that initial living standards were higher among low-growth households in both treatment and control groups. While further analysis is needed to corroborate this interpretation, it has the provocative implication that the RBD program could have reached further down the income distribution by lowering initial asset requirements and targeting the initially less well-off farmers.
If it is not initial level of wellbeing that explains who benefits more from RBD services, then what does? While future analysis will explore this question, one possible answer is that high performance (and therefore high expected impact) can be attributed to an easily observable characteristic. In this case, program targeting could be improved with resources devoted to the top half of the population that would be expected to benefit. Or, it may even be that high performance characteristic is something that can be changed (for example, through good capital access) to improve overall program performance.
On the other hand, it is also possible that high performance and high impact cannot be attributed to any easily observable characteristic. For example, we know that not everyone succeeds in business (even when trying). It may well be that the high-growth households in both treatment and control groups are simply better entrepreneurs and that RBD services help these entrepreneurs do even better, while having little impact on less able entrepreneurs.
If those with good entrepreneurial skills cannot be distinguished ahead of time from those with low entrepreneurial skills, then projects like the RBD simply need to be understood as “leaky bucket” endeavors, in which some project expenditures leak to those unable to benefit from them. In summary, the finding of heterogeneous impacts is important, but it remains to be seen if that finding has explicit programming implications or is simply an indication that one cost of RBD-like projects is the expenditure of funds on those who will not benefit from them. A future brief will explore this topic further.
Deepening the Evaluation
Early results suggest that the RBD project does have significant impact on the economic wellbeing of many rural households, but it does not work for everyone. In light of the initial evidence of uneven impact among participants, we will attempt to clarify why some households gain significant impact from the project while other households participate but do not enjoy benefits. Variables such as credit constraints and tenure conditions could explain some of this impact heterogeneity. Program expenditures also are higher for some activities (for example, livestock) than for others (for example, sesame), and it may be that the larger benefits simply reflect this differential.
The analysis also shows that the RBD project did not directly benefit many households below the mid-point of the rural income distribution. How far down the distribution a technology and business skill transfer project can go is an important and always difficult question. The results so far obtained from this study show that the effect of the program has no relation to the initial living standard of a household. Households close to the eligibility floor could obtain the same absolute benefit from the RBD project as easily as households with a higher endowment of assets. If substantiated, this finding suggests that this MCA project, as well as similar projects, might consider reaching further down the wealth distribution.
Further Reading
Carter, M.R. 2007. “Impact Evaluation Strategy for the MCA-Nicaragua Program.”
Carter, M.R. and P.E. Toledo. In progress. “Impact of Business Services on the Economic Wellbeing of Farmers in Nicaragua: Midterm Results.” University of Wisconsin-Madison.
Millennium Challenge Corporation. 2009. “Monitoring and Evaluation Plan Nicaragua.” http:// www.mcc.gov/mcc/bm.doc/nicaraguamande_plan.pdf.
Toledo, P.E. In progress. “On the Validation of a Randomized Field Experiment in Nicaragua.” University of Wisconsin-Madison
Publication made possible by support in part from the US Agency for International Development Cooperative Agreement No. EDH-A-00-06-0003-00 through the Assets and Market Access CRSP. All views, interpretations, recommendations, and conclusions expressed in this paper are those of the authors and not necessarily those of the supporting or cooperating organizations.