
This brief is a summary of the paper:
Estefania-Salazar, E., Carter, M., Iglesias, E., Escribano, A. 2025. “The Economic Gains from Breaking Boundaries: Reformulating Index Insurance Zones to Maximize Lower Tail Dependence.” NBER Working Paper 32618.
Index insurance payouts are made when an index that proxies for farmer losses in a geographic zone crosses a threshold. For example, an index may be triggered when rainfall or vegetation levels—measured remotely—fall a certain level below normal.
Basis risk describes the possibility that an insured party suffers a crop loss that the insurance is intended to cover, but receives no payment because the insurance index fails to register the loss. Basis risk arises from two sources:
1. Inaccurate detection: One source of basis risk can result from an index that does not accurately detect average losses in the zone. This issue has received significant attention, and advances in remote sensing and data analytics are driving the development of more accurate indices.
2. Intra-zone variation: Basis risk also occurs when losses are experienced among some individuals but the zone average, though accurate, does not show a loss. This is particularly a challenge in zones that contain significant intra-zone variations in losses. For example, variations in soil type, terrain, and rainfall patterns may lead to different yield outcomes. Less attention has been paid to this issue, though its impact on index insurance is just as significant. It is the subject of this brief.
Insurance zones tend to be set along administrative boundaries, which may have no relationship to the physical geography. This brief describes a method for designing zones to reduce basis risk and increase the value of insurance to farmers.
Similar Outcomes Amid Poor Conditions
Historical data offers an opportunity to design zones according to patterns of agricultural production across farms through multiple seasons.
Our research shows that index insurance will hold more economic value when zones group farms that tend to experience similarly low levels of production at the same times. In statistical terms, this is high lower tail dependence.
Figure 1 illustrates the concept. The graphs show distributions of yields across a large number of producers and zones under a hypothetical index insurance contract that triggers when losses exceed 30 percent of normal yields. Individual production is plotted on the x-axis, with the average yield for the zone along the y-axis.
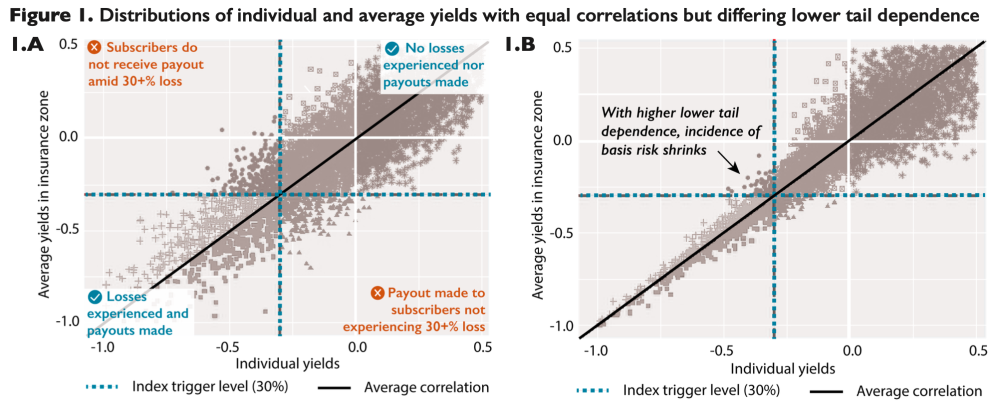
The majority of data points are in the upper-right quadrant, where neither the individual farmer nor the zone average experienced payout-triggering losses. With no payouts, the insurance is functioning as intended.
The lower tail of the data includes the other three quadrants. In the lower-left quadrant, the insurance is also functioning as intended; both individual farmers and the average had losses, so a payout would be made to those with losses as intended. In the other two quadrants, the insurance is not working as intended; in the upper-left, it does not register a loss for those who experienced one (basis risk); in the lower-right, it makes a payout to individuals not experiencing a 30% loss.
Compared with Graph 1.A, the lower tail of Graph 1.B shows greater lower tail dependence. Average individual losses tend to be quite close to zone averages. With greater lower tail dependence, incidence of basis risk is reduced. In turn, decreased basis risk increases the economic value the insurance provides.
It is important to note that lower tail dependence is not equivalent to correlation. In fact, the two graphs have the same level of statistical correlation.
A Trial Application
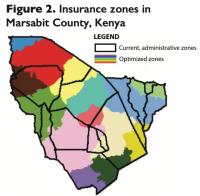
We used historic vegetation data and machine learning to determine the optimal zones for livestock insurance in Marsabit County in northern Kenya. We made an algorithm that would re-group the county’s territory into 14 contiguous zones that maximize lower tail dependence among livestock outcomes (predicted by satellite-derived vegetation levels) across 14 seasons.
Figure 2 shows both the status quo administrative zone boundaries and shaded optimized zones determined by the algorithm. We see that many of the current zones include multiple optimized zones, reflecting differences in geography that impact grazing vegetation levels but are ignored by administrative boundaries.
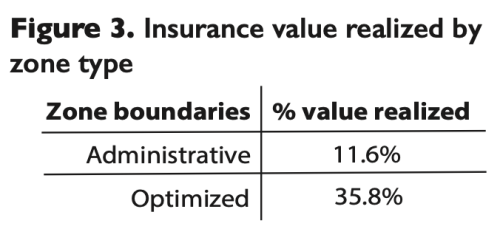
We calculated the relative benefit the index insurance would have under the optimized zones compared with the administrative zones. We found the zones optimized for high lower tail dependence could significantly increase the economic value of the insurance.
Supposing an insurance contract that would be triggered every 6-7 years, we found that the insurance would provide three times the economic value under the optimized zones compared to administrative zones. See Figure 3.