
As the frequency and severity of climate and other shocks expand, governments and development agencies undertake myriad actions intended to improve households’ economic resilience. However, they have limited knowledge of the strategies’ efficacy, as most programs do not measure resilience. Instead, many use proxy indicators that may be based on untested assumptions about what creates resilience, rather than measuring households’ actual economic experience—cumulative losses and recovery—amid shocks. As a result, policymakers struggle to make cost-benefit analyses and invest in the types of interventions that maximize resilience impact.
A New Method for Measuring Economic Resilience
The Feed the Future Innovation Lab for Markets, Risk and Resilience has developed a method for measuring economic resilience. The cumulative current and future losses and recovery of a household exposed to shock are compared to a counterfactual measure of what the economic well-being would have been without the shock.
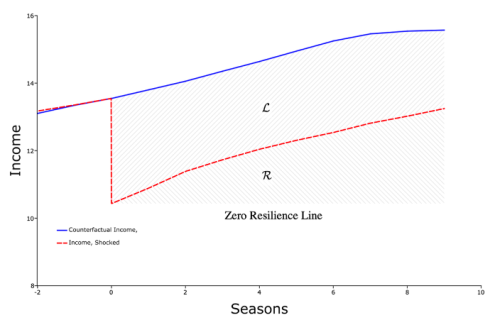
With reference to Figure 1, a resilience value is calculated using the area between the household’s shock recovery path (red line) and two other lines:
1. The blue ‘counterfactual’ pathway, which is an estimate derived from a statistical method of what the household’s experience would have been without the shock. The area between the two pathways, L reflects the cumulative Losses the household experienced due to the shock.
2. The ‘zero resilience’ line, which shows a household that does not recover at all from the shock. The area, R, reflects Recovery from the shock.
The value of a household’s economic resilience over time period n is the proportion of the area between the counterfactual no-shock and zero resilience lines that is in area R; that is:
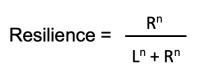
Within this model, a resilient household maintains well-being close to the no-shock counterfactual, and has a resilience value approaching 1. The resilience value lowers for households with deeper losses and slower recoveries closer to the zero line. Negative resilience occurs if a household’s situation continues to deteriorate after a shock and they fall into a poverty trap.
Multiple Economic Well-being Metrics Can Be Used
Income is the economic metric used in the example, though other metrics of well-being (e.g., assets, spending, nutritional intake) can be used as relevant to the program or policymakers, so long as the data is carefully interpreted. For example, a household that has fallen into a poverty trap and abandons investments in a business could experience a temporary uptick in consumption as business assets are sold, while their long-term well-being has fallen. Looking at a household’s shock and recovery experience across several metrics could produce a deeper picture of a household’s resilience.
Evaluating Intervention Impacts on Shock Recovery
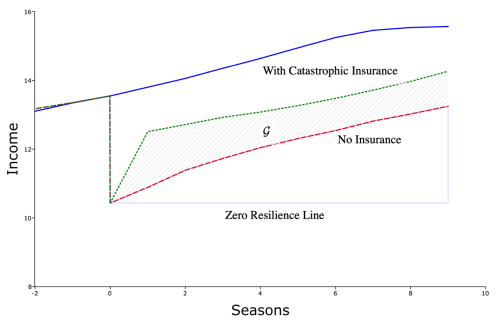
Plotting the experience of households receiving a humanitarian or development intervention shows the strategy’s impact on recovery. In Figure 2, the green line shows the path of a household that received an insurance payout. The area marked G shows resilience Gains made by an intervention, in comparison to households that did not receive the intervention.To compare different strategies’ impact on post-shock recovery, policymakers can compare G values across them. The G measure also allows calculation of programs’ benefit cost ratio, as G is compared to expenditure on the intervention.
Putting the Measure into Practice
Calculation of the resilience measure requires panel data that follows a household’s well-being metric over a number of seasons or years.
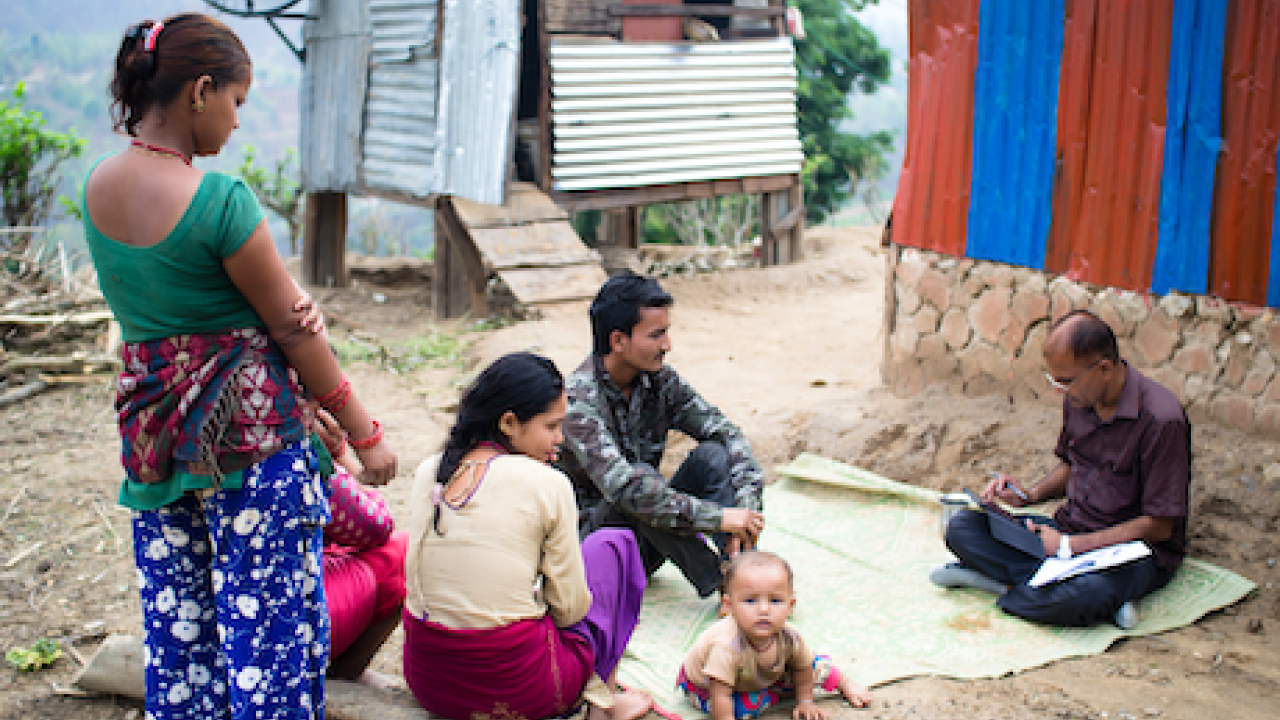
To test the measure, the Innovation Lab used data collected from 2015 to 2018 in Mozambique and Tanzania, as part of a study following the introduction of insured, stress-tolerant maize seeds. Drought and other shocks had hit a portion of farmers in the sample. Farmers without access to the insured seeds lost nearly half their crop and undertook coping strategies that reduced their farms’ capital; two years following the drought, they had a resilience measure of .18. Farmers who received an in-kind insurance payout of improved seeds did not fall as far (due to drought-tolerant seeds) and were able to start recovering almost immediately; they had a resilience measure of .82. Comparing Gains to the cost of the intervention yields a benefit cost ratio of 6.8; that is, each $1 spent led to $6.8 in reduced losses from shock.